|
|
Robert Johannessen: interactive visual analysis of renal perfusion data
Abstract
Four dimensional perfusion data provides medical doctors with a wealth of information and may pose
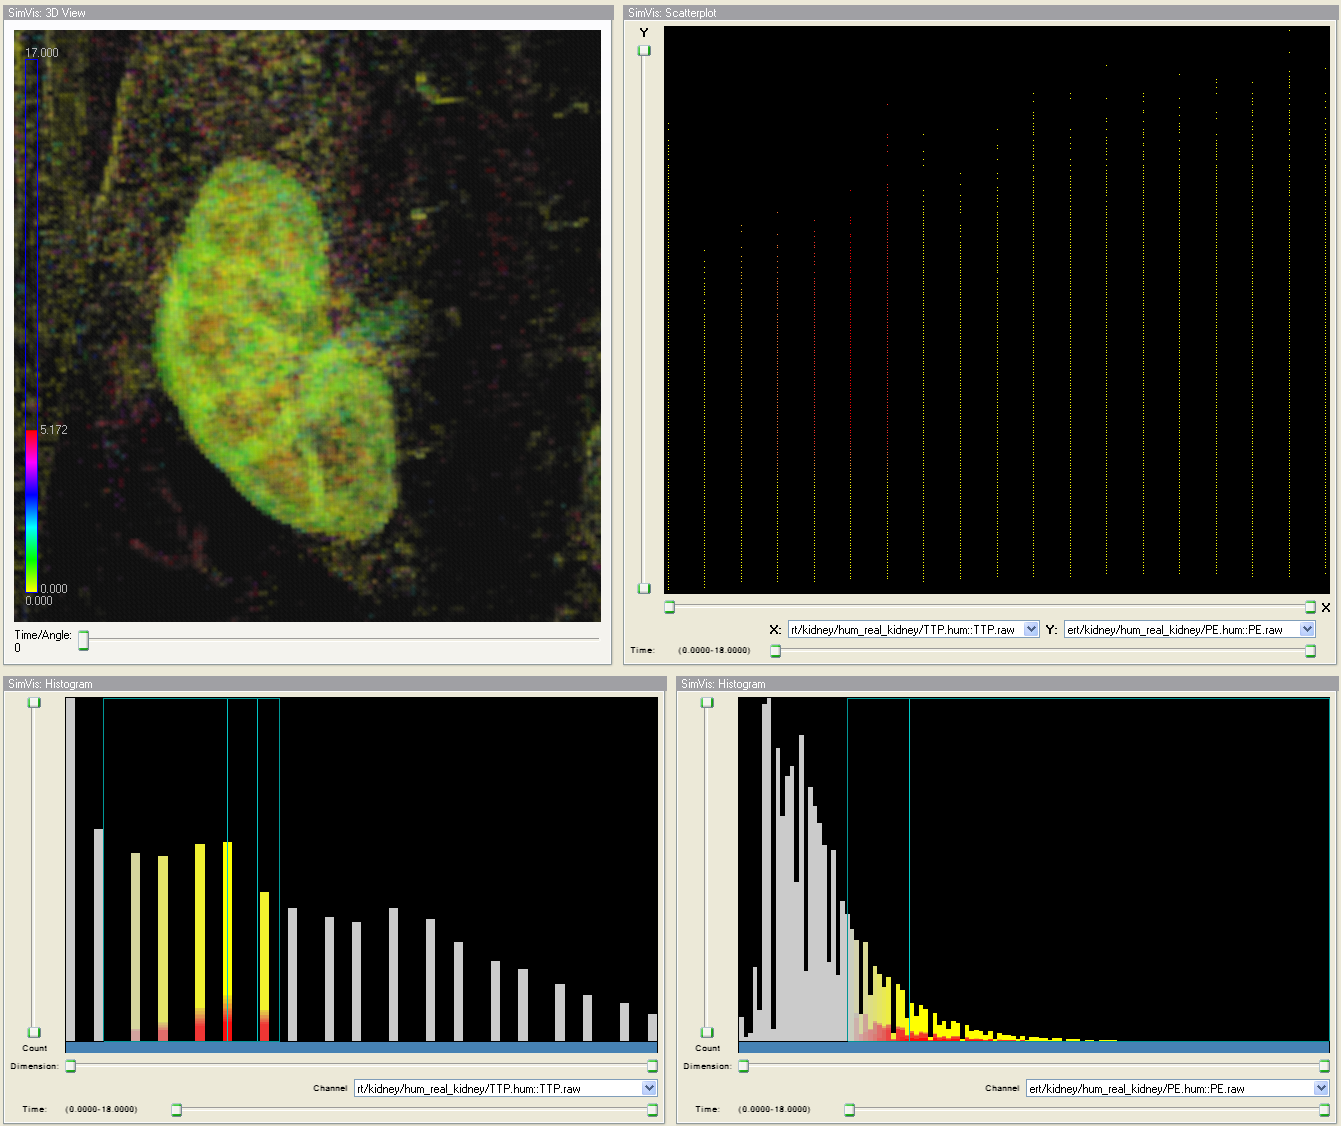
interpretation challenges. For this INF219 project, programs were designed and developed to convert raw 4D
perfusion data into a set of shape parameter volumes which simplify the representation of the time/intensity
curves (TICs) at each voxel. The volumes were used for interactive visual analysis (IVA) with linked views
and soft brushing, which offers a method of extracting information from large time dependent data sets.
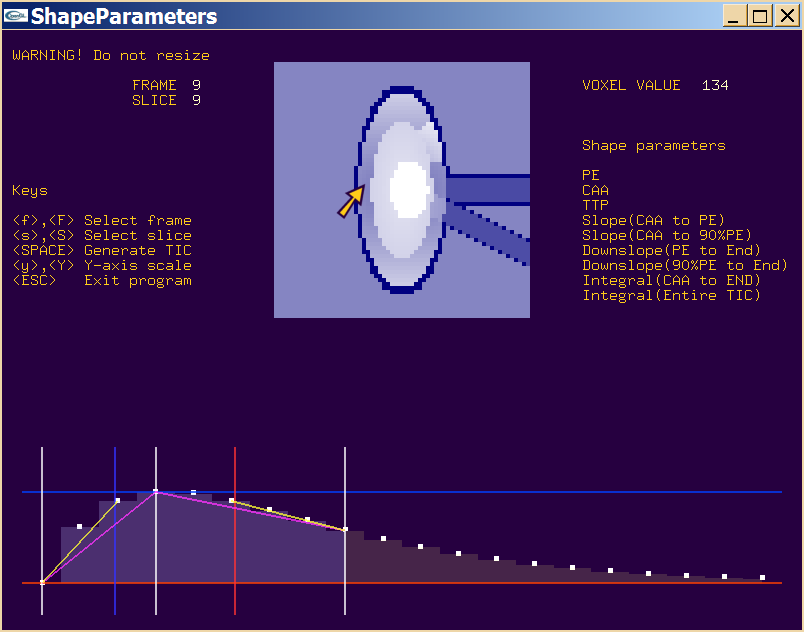
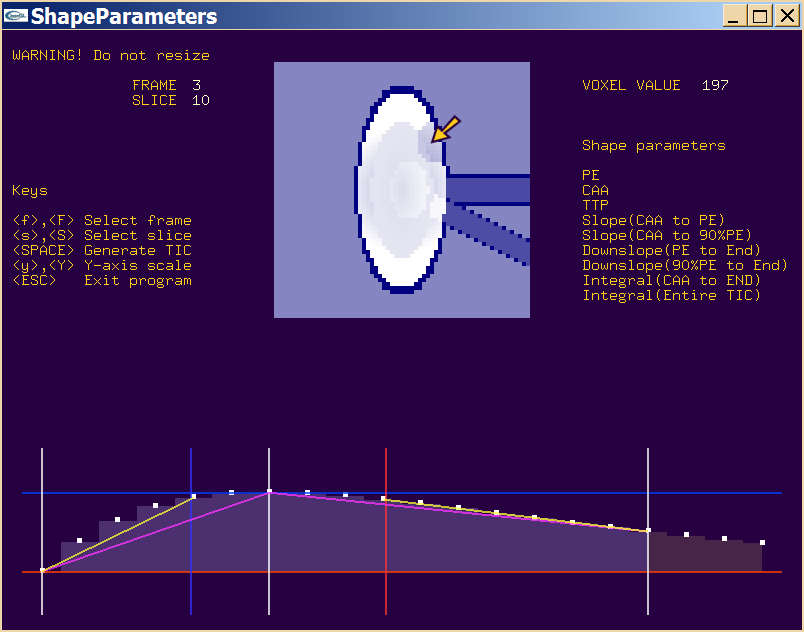
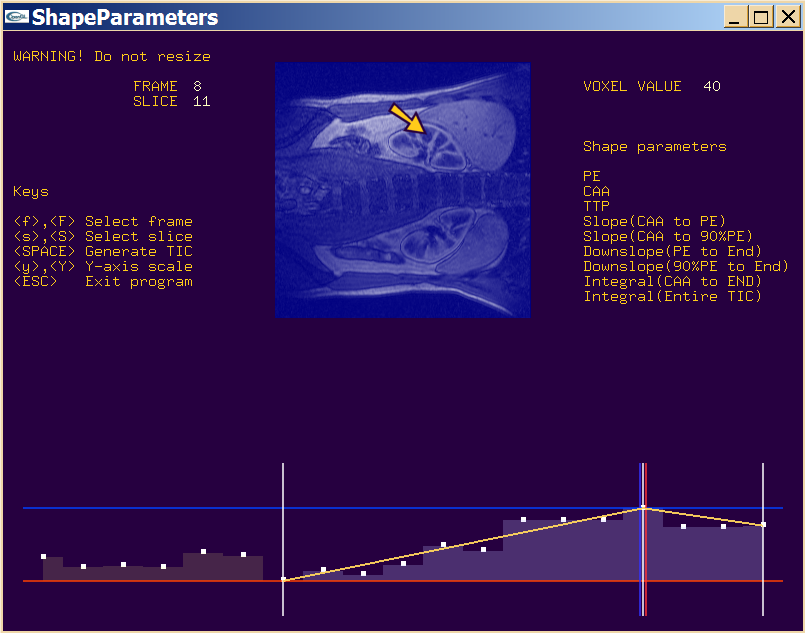
One of the programs written for this project allowed interactive viewing of a data set, its TICs and shape
parameters, and has proved useful in exploring the TICs. This project provided excellent experience with
programming C++ using OpenGL and with interactive visualization and analysis.
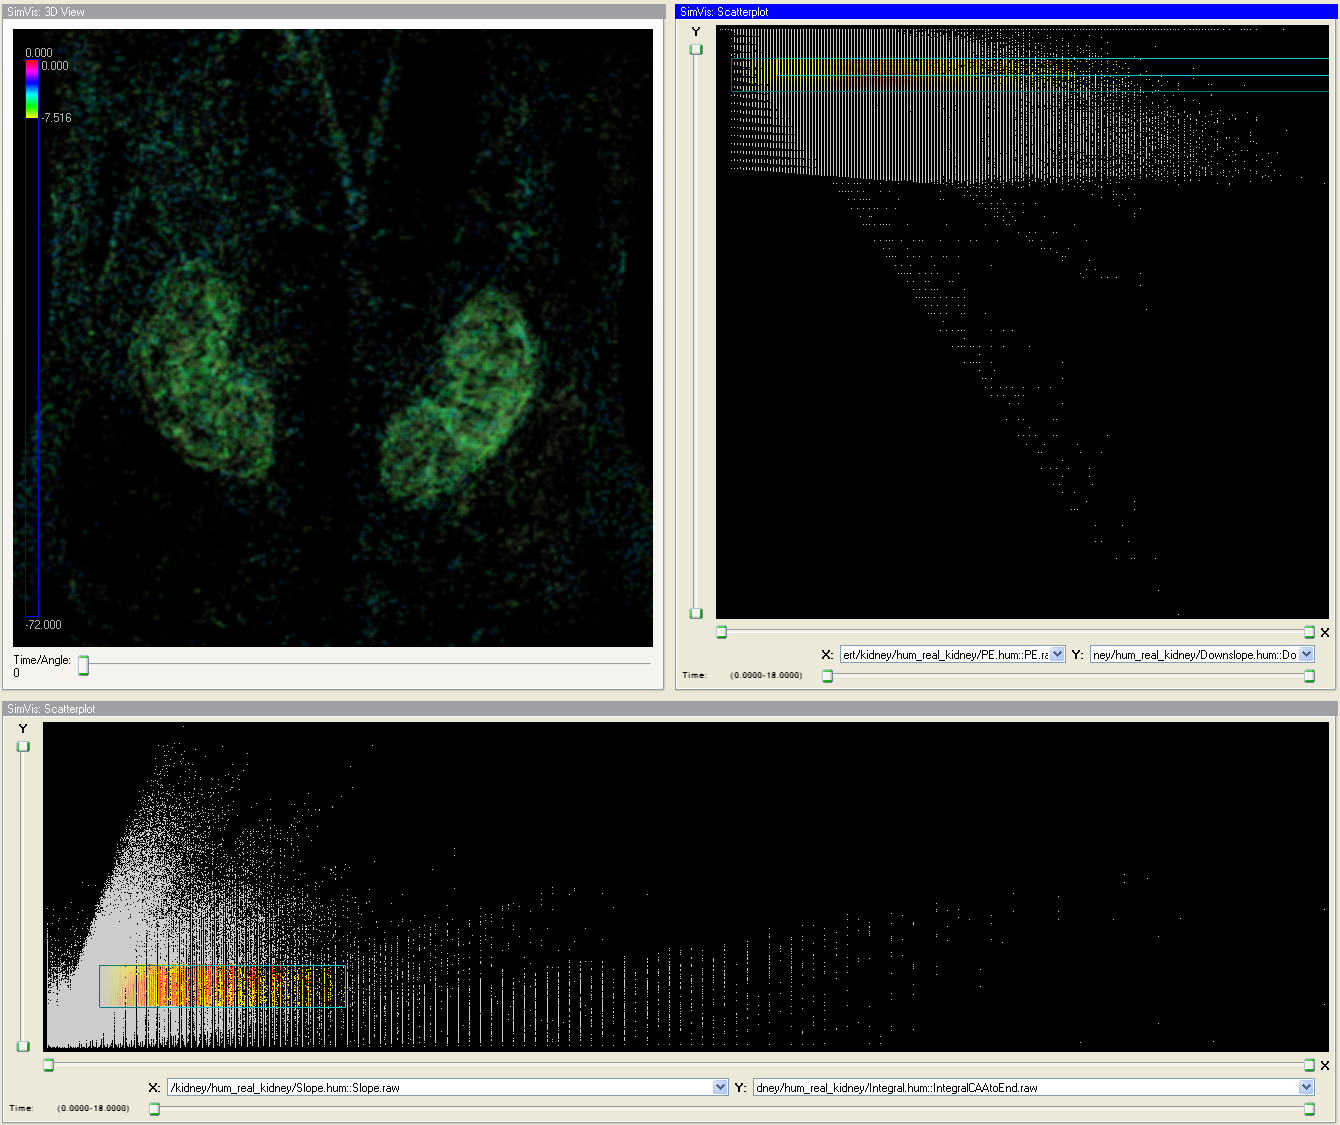
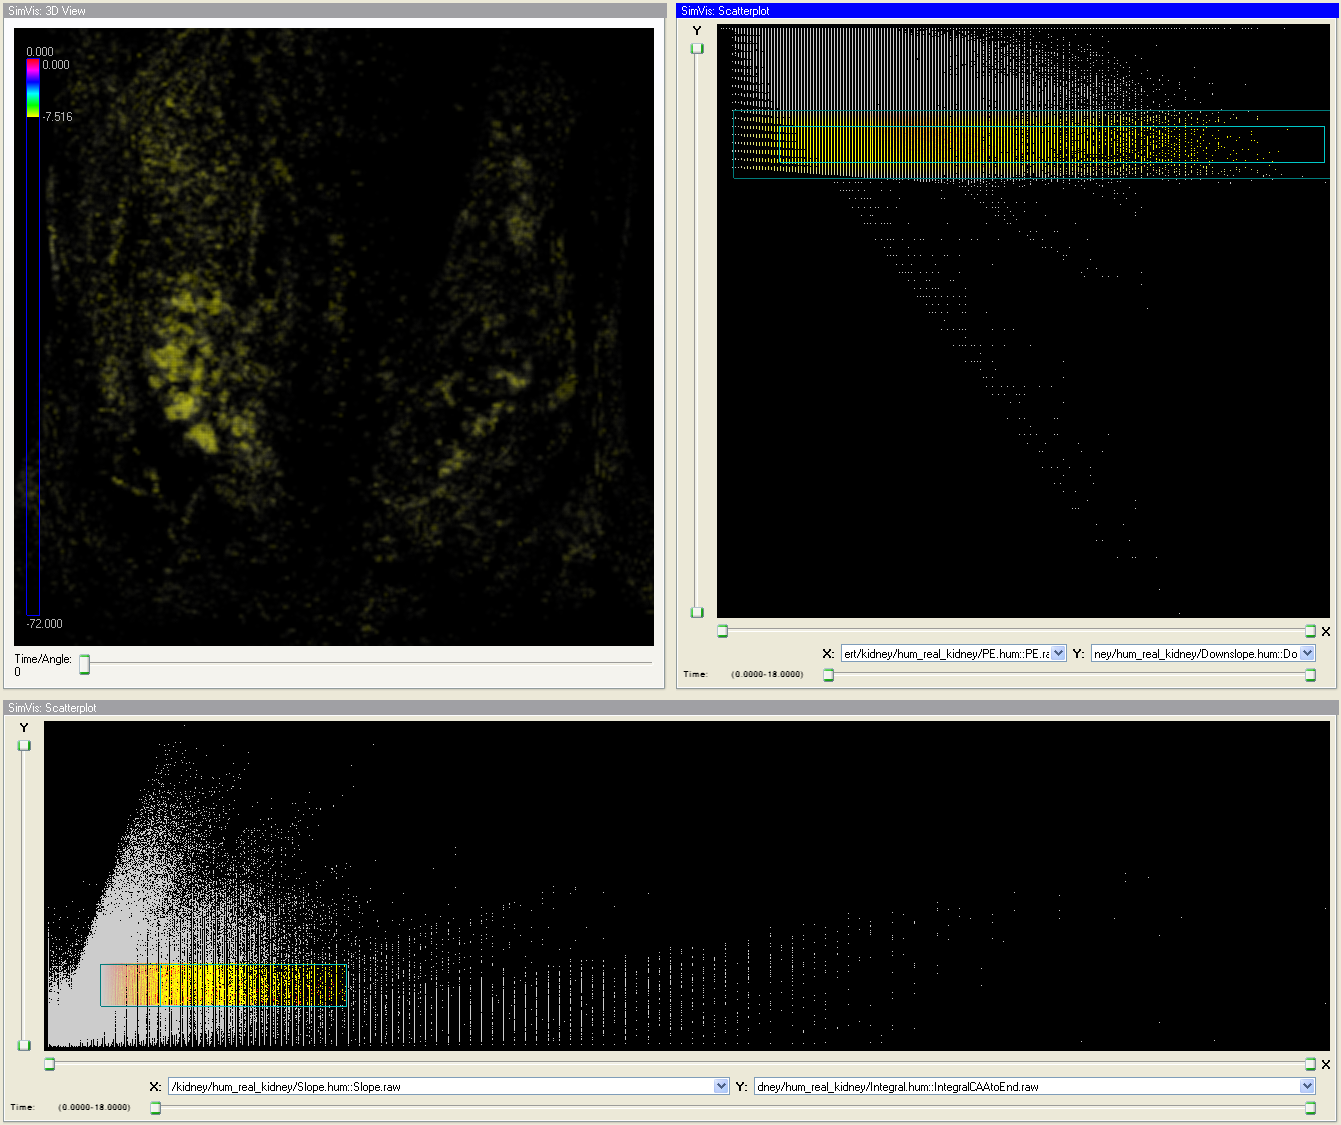
Screenshots


Resources
Project report
|